How To Analyze Apple Health Data With Python
In this article we learn how to analyze Apple Health Data with Python.
In this article we learn how to analyze Apple Health Data with Python. We learn how to
#more
- Load the workout data from the xml file into a pandas DataFrame
- Extract different statistics like duration and kcal burned per workout
- Extract, analyze, and plot the heart rate data
- Filter workouts by type or by time period
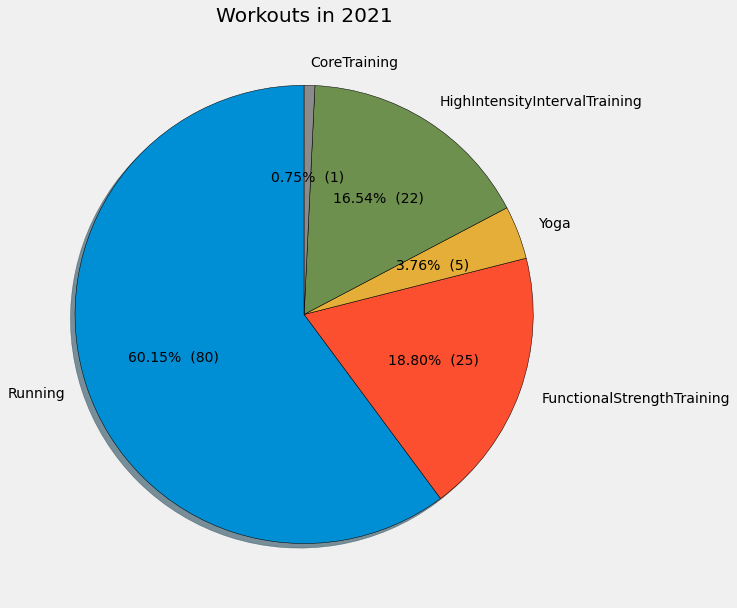
- Plot a pie chart to see the percentage of different workout types
Get the data
On your iPhone go to Health App -> Profile -> Export data -> Send to your computer.
This should send a Export.zip file to your Downloads folder. Create a new folder for this project and put the Export.xml file into another subfolder called data. All other files can be ignored here.
Dependencies
We need pandas and matplotlib. Create a new project and install both libraries, e.g. with pip:
$ pip install pandas matplotlib
Import XML in Python
Create a new file (or a jupyter notebook) in the base of your project folder and then import the data:
import xml.etree.ElementTree as ET
import pandas as pd
import datetime as dt
import matplotlib.pyplot as plt
plt.style.use("fivethirtyeight")

# create element tree object
tree = ET.parse('data/Export.xml')
# for every health record, extract the attributes
root = tree.getroot()
record_list = [x.attrib for x in root.iter('Record')]
Create Pandas DataFrame
Create a pandas DataFrame. Then we adjust some data types and value names:
record_data = pd.DataFrame(record_list)

# proper type to dates
for col in ['creationDate', 'startDate', 'endDate']:
    record_data[col] = pd.to_datetime(record_data[col])

# value is numeric, NaN if fails
record_data['value'] = pd.to_numeric(record_data['value'], errors='coerce')

# some records do not measure anything, just count occurences
# filling with 1.0 (= one time) makes it easier to aggregate
record_data['value'] = record_data['value'].fillna(1.0)

# shorter observation names
record_data['type'] = record_data['type'].str.replace('HKQuantityTypeIdentifier', '')
record_data['type'] = record_data['type'].str.replace('HKCategoryTypeIdentifier', '')
record_data.tail()
The record_data looks like this:

Extract workouts
Extract only the workout data and create another DataFrame for it:
workout_list = [x.attrib for x in root.iter('Workout')]

# create DataFrame
workout_data = pd.DataFrame(workout_list)
workout_data['workoutActivityType'] = workout_data['workoutActivityType'].str.replace('HKWorkoutActivityType', '')
workout_data = workout_data.rename({"workoutActivityType": "Type"}, axis=1)

# proper type to dates
for col in ['creationDate', 'startDate', 'endDate']:
    workout_data[col] = pd.to_datetime(workout_data[col])

# convert string to numeric
workout_data['duration'] = pd.to_numeric(workout_data['duration'])
workout_data['totalEnergyBurned'] = pd.to_numeric(workout_data['totalEnergyBurned'])
workout_data['totalDistance'] = pd.to_numeric(workout_data['totalDistance'])
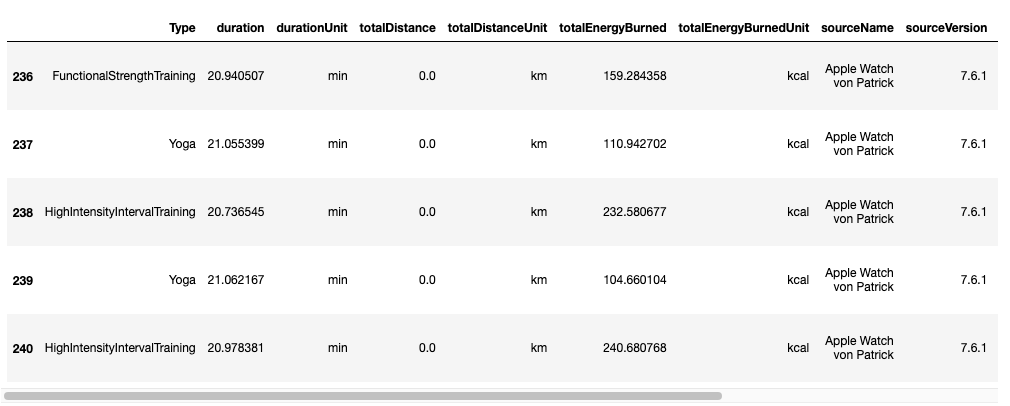
workout_data.tail()
This will show something like this. (Note: The additional columns device, creationDate, startDate, and endDate are not visible on this image:

Get the number of workouts
num_workouts = workout_data.shape[0]
Filter workouts by type
def get_workouts(df, workout_type):
    return df[df["Type"] == workout_type]

# to see the different workout types use:
print(workout_data.Type.unique())
# ['Running' 'FunctionalStrengthTraining' 'Yoga'
#  'HighIntensityIntervalTraining' 'CoreTraining']

running_data = get_workouts(workout_data, "Running")
Get workouts in certain time period
def get_workouts_from_to(df, start, end):
    start = pd.to_datetime(start, utc=True)
    end = pd.to_datetime(end, utc=True)
    workouts = df[df["creationDate"] >= start]
    workouts = workouts[workouts["creationDate"] <= end]
    return workouts

lower_time = dt.date(2021, 1, 1)
upper_time = dt.date(2022, 1, 1)
workouts = get_workouts_from_to(workout_data, lower_time, upper_time)

# or relative to the current day
today = dt.date.today()
xdaysago = today - dt.timedelta(days=7)
# first_of_month = today - dt.timedelta(days=today.day - 1)
workouts = get_workouts_from_to(workout_data, xdaysago, today)
Get last workout
last_workout = workouts.iloc[[-1]]
Extract heart rate
Extract the heart rate data and put it into a DataFrame. Then we can extract heart rate statistics for certain workouts:
def get_heartrate_for_workout(heartrate, workout):
    def get_heartrate_for_date(hr, start, end):
        hr = hr[hr["startDate"] >= start]
        hr = hr[hr["endDate"] <= end]
        return hr
    return get_heartrate_for_date(heartrate, workout["startDate"].item(), workout["endDate"].item())

heartrate_data = record_data[record_data["type"] == "HeartRate"]

# Extract heartrate statistics for certain workout
last_workout = workouts.iloc[[-1]]
heartrate_workout = get_heartrate_for_workout(heartrate_data, last_workout)
minh = heartrate_workout["value"].min()
maxh = heartrate_workout["value"].max()
meanh = heartrate_workout["value"].mean()
print(last_workout.Type.item(), minh, maxh, meanh)
# HighIntensityIntervalTraining 74.0 176.0 151.2590909090909
Plot heart rate for workout
heartrate_workout.plot(x='endDate', y='value', style='r|', markersize=8.5, figsize=(12, 6))

Put more statistics into DataFrame
def get_hr_for_workout_row(workout, heartrate):
    def get_hr_for_date(hr, start, end):
        hr = hr[hr["startDate"] >= start]
        hr = hr[hr["endDate"] <= end]
        return hr
    return get_hr_for_date(heartrate, workout["startDate"], workout["endDate"])

def convert_to_minute_proportion(number):
    return int(number) + ((number % 1) / 100 * 60)

def get_pace_for_workout(workout):
    if workout["totalDistance"] == 0.0:
        return 0.0
    # pace=min/km
    pace = workout["duration"] / workout["totalDistance"]
    return convert_to_minute_proportion(pace)


workouts["heartrate"] = workouts.apply(lambda row: get_hr_for_workout_row(row, heartrate_data), axis=1)
workouts["hr_mean"] = workouts.apply(lambda row: row['heartrate']["value"].mean(), axis=1)
workouts["pace"] = workouts.apply(lambda row: get_pace_for_workout(row), axis=1)
Get statistics
def get_stats(workouts):
    total_kcal = workouts["totalEnergyBurned"].sum()
    total_dist = workouts["totalDistance"].sum()
    total_time = workouts["duration"].sum()
    total_time_hours = convert_to_minute_proportion(total_time / 60)
    total_time_mins = convert_to_minute_proportion(total_time)

    avg_kcal = workouts["totalEnergyBurned"].mean()
    avg_dist = workouts[workouts["Type"] == "Running"]["totalDistance"].mean()
    avg_pace = workouts[workouts["Type"] == "Running"]["pace"].mean()
    avg_time = workouts["duration"].mean()
    avg_time_hours = convert_to_minute_proportion(avg_time / 60)
    avg_time_mins = convert_to_minute_proportion(avg_time)

    print(f"Workout statistics from {lower_time} to {upper_time-dt.timedelta(days=1)}")
    print(f"{workouts.shape[0]} workouts")
    print(f"Time: {total_time_mins:.2f} minutes ({total_time_hours:.2f} hours)\nCalories burned: {total_kcal:.2f}kcal\nRunning distance: {total_dist:.2f}km")
    print("\nAverage per workout:")
    print(f"Time: {avg_time_mins:.2f} minutes ({avg_time_hours:.2f} hours)\nCalories burned: {avg_kcal:.2f}kcal\nRunning distance: {avg_dist:.2f}km\nRunning pace: {avg_pace:.2f}km/h")

get_stats(workouts)
Workout statistics from 2021-01-01 to 2021-12-31
133 workouts
Time: 2699.33 minutes (44.60 hours)
Calories burned: 25630.65kcal
Running distance: 311.67km

Average per workout:
Time: 20.18 minutes (0.20 hours)
Calories burned: 192.71kcal
Running distance: 3.90km
Running pace: 5.69km/h
Plot workout pie chart
def plot_workouts(workouts):
    labels = []
    slices = []
    for wo_type in workouts.Type.unique():
        labels.append(wo_type)
        wo_of_type = workouts[workouts["Type"] == wo_type]
        num_workouts_of_type = wo_of_type.shape[0]
        slices.append(num_workouts_of_type)

    def make_autopct(values):
        def my_autopct(pct):
            total = sum(values)
            val = int(round(pct*total/100.0))
            return '{p:.2f}%  ({v:d})'.format(p=pct,v=val)
        return my_autopct

    plt.figure(figsize=(10, 10))
    plt.pie(slices, labels=labels, shadow=True,
            startangle=90, autopct=make_autopct(slices),
            wedgeprops={'edgecolor': 'black'})

    plt.title("Workouts in 2021")
    plt.tight_layout()
    plt.show()

plot_workouts(workouts)

FREE VS Code / PyCharm Extensions I Use
✅ Write cleaner code with Sourcery, instant refactoring suggestions: Link*
Python Problem-Solving Bootcamp
🚀 Solve 42 programming puzzles over the course of 21 days: Link*